AKA Where should my parents-in-law be looking for a house?
With grandchildren numbers rapidly increasing, my wife’s parents have decided to move closer to her and her sister. Houses are uniformly laid out, and roads aren’t always conveniently point-to-point, so this has lead to discussions about what area is suitable for the search
The problem
Given two anchor locations, and a maximum drive time to each, what is the correct region in which my parents-in-law should search for a house.

The solution
After the obligatory googling, I think I’ve found the bones of a solution:
- OSMnx – This provides a way to pull data from OpenStreetMap (OSM), including the places, roads and map itself. There are some excellent examples in the git repo, and Geoff Boeing seems to be something of the god in this field
- networkx / geopandas – Some useful functions for doing the maths
- Folium – For displaying my output
My steps are:
- Find 2 OSM nodes to represent my locations
- Create a zone around each which represents the distance which can be travelled in a given time
- Find the intersection between those two zones
- Draw it on a map
1. Finding my points
From the brief time I’ve spent looking at it, OSM seems to work on two main data features, Nodes and Edges. A node is a location of interest on the map, and could be something like a house or shop, or might just be a bit of road. The edges are the (hopefully) legal moves between nodes, and come with some useful metadata like the speed limit on a particular road, and the distance.
For starters I’ll create variables with the rough locations we’re working from
#Setup some locations to work with, my two locations, and a roughly midpoint (might be useful later)
oving=(51.88550,-0.85919)
buckingham=(52.00271, -0.97210)
midPoint=(52.00,-.9)
Then use the OSMnx package to pull back map detail from that
Graw=ox.graph_from_point(mid_point, dist=25000, network_type='drive' )
This takes a few minutes, and populates 4 json files of about 5mb each with lots of location data.
oving_center_node = ox.get_nearest_node(Graw, oving)
buckingham_centre_node = ox.get_nearest_node(Graw, buckingham)
G = ox.project_graph(Graw)
I then use get_nearest_node to give me a known node close to both of my locations, finally ‘projecting’ the data, which as best I understand it, means I’m taking the 3d Lat/Long information, and flattening it to a 2d co-ordinate system from further analysis.
2./3. Create the travel zone around each / find the intersection
This is pulled from another piece of code in the OSMnx git examples, I think the idea is that the ego_graph is able to find all the nodes within a certain distance of the original – in this case the distance is time:
#Use the networkx 'ego_graph' function to gather all my points with a 25 minute drive time
ovingSubgraph       = nx.ego_graph(G, oving_center_node, radius=25, distance='time')
buckinghamSubgraph  = nx.ego_graph(G, buckingham_centre_node, radius=25, distance='time')

#To create the overlap, I found this snippet of code which just removes the nodes only in one side
jointSubgraph=ovingSubgraph.copy()
jointSubgraph.remove_nodes_from(n for n in ovingSubgraph if n not in buckinghamSubgraph)
Then we need to create some polygons which enclose all the nodes:
#For each location, get the points, and then use geopandas to create a polygon which completely encloses them
ovingPoints = [Point((data['lon'], data['lat'])) for node, data in ovingSubgraph.nodes(data=True)]
ovingPoly = gpd.GeoSeries(ovingPoints).unary_union.convex_hull

buckinghamPoints = [Point((data['lon'], data['lat'])) for node, data in buckinghamSubgraph.nodes(data=True)]
buckinghamPoly = gpd.GeoSeries(buckinghamPoints).unary_union.convex_hull

jointPoints = [Point((data['lon'], data['lat'])) for node, data in jointSubgraph.nodes(data=True)]
jointPoly = gpd.GeoSeries(jointPoints).unary_union.convex_hull
4. Draw it on a map
Then, finally plot the 3 regions, and 2 locations on a folium map
#Define some styles for my areas
style1 = {'fillColor': '#228B22', 'color': '#228B22'}
style2 = {'fillColor': '#8B2222', 'color': '#8B2222', 'marker_color' : 'green'}
style3 = {'fillColor': '#22228B', 'color': '#22228B', 'marker_color' : '#22228B'}

#Create a new Foilum map to show my data
mapOutput = folium.Map(location=oving,tiles="openstreetmap",   zoom_start=11)

#Add my polygons
folium.GeoJson(jointPoly, name='Overall', style_function=lambda x:style1).add_to(mapOutput)
folium.GeoJson(ovingPoly, name='Oving', style_function=lambda x:style2).add_to(mapOutput)
folium.GeoJson(Point(oving[1],oving[0]), name='Oving', style_function=lambda x:style2).add_to(mapOutput)
folium.GeoJson(buckinghamPoly, name='Buckingham', style_function=lambda x:style3).add_to(mapOutput)
folium.GeoJson(Point(buckingham[1],buckingham[0]), name='Buckingham', style_function=lambda x:style3).add_to(mapOutput)

#Show the output
mapOutput
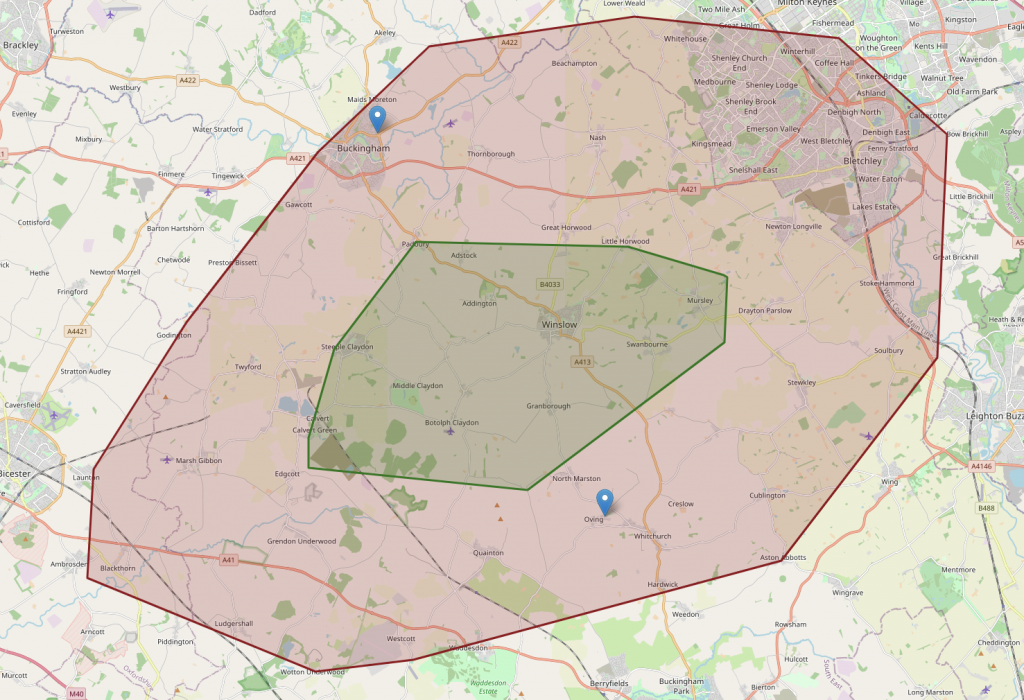
and…

Ta-da! we have a working solution.. and much quicker than usual..
But, wait. How is it possible that from the lower location it’s possible to get almost all the way to the upper location, but not vice-versa?
Also, that middle ‘green’ section (which is a bit hard to see) doesn’t entirely cover the intersection.
What went wrong
I think 2 things are broken:
- The ‘ego graph’ function isn’t correctly returning the nodes with a travel time
- The generated polygons are optimised to enclose regions in a way which could under play the intersection
I think #1 is the result of trying to pull apart another solution, the ego graph is obviously unable to perform the analysis I want to do. I think it’s doing a simpler calculation of all the nodes within 25 connections of the original. The lower point is in a village, and so will need to travel further to reach 25.
#2 is probably more of a finessing problem.
Improving the solution
I need to find a way to identify all the points within a certain drive time of the starting point. Luckily OSMnx has some extra features to help with that.
ox.add_edge_speeds(Graw)
ox.add_edge_travel_times(Graw)
This should add some extra data to each edge to help compute the travel time between each
#Get the shortest path
shortest_path = ox.shortest_path(Graw, oving_center_node, buckingham_centre_node, weight='length')
#Plot it on a map
ox.plot_route_folium(Graw, shortest_path)

#Get the shortest path
shortest_path_time = nx.shortest_path_length(Graw, oving_center_node, buckingham_centre_node, weight='length')
print(shortest_path_time)

18955.. Presumably metres? a quick check of google maps suggests it’s probably true. so 18km.
#Get the shortest path
shortest_path_time = nx.shortest_path_length(Graw, oving_center_node, buckingham_centre_node, weight='travel_time')
print(shortest_path_time)

Weighting it by travel time returns 1040. If that’s in seconds, the trip is about 17 minutes.
I think the journey actually takes more like 25, even if we ignore traffic, I don’t think it’s correctly pricing in the time to accelerate, and things like traffic. But anyway, we have a way forward.
The ‘not very optimal, but will probably work’ solution goes like: Loop through all the nodes in the overall map, check the travel time, keep them (if it’s below the threshold)
ovingPoints = [Point((data['lon'], data['lat'])) for node, data in G.nodes(data=True) if nx.shortest_path_length(Graw, oving_center_node, node, weight='travel_time')<25*60]
So I ran that, and it took ages. There are 39k nodes in that section of the map. There’s going to be a huge amount of recursion going on too, so not very efficient. I need a different approach
Intermission: How *does* google calculate drive time?
While playing around with this I checked the drive time to a few other places and it seems to always be very fast compared to google

The distances are thereabouts, the time is the problem. Digging in a bit more, the time calculation is literally adding the time to traverse each edge, assuming you can travel at the maximum speed possible on that bit of road. Not hugely realistic.

I’m not really here to replicate google, at very least I’d just hook into the API, but that’s for another day. For now, I’ll just recalculate my speed for any journey which has an average above 52. This will reduce the likelihood of very distant nodes making it into the allowed zone, which is what I’m wanting anyway.
Back to the problem
My latest issue is that I can’t check every node in the graph in a reasonable amount of time. So the next idea is to reduce the scope of the checking. I don’t need to check every node, but I want to make sure I cover a reasonable area

If I imagine a grid over the whole map area, I can loop through regular points on that grid, get a node near the point, and then check the distance from my starting points to that node
First, get the bounding box of the map area:
north, south, east, west = ox.utils_geo.bbox_from_point(midPoint, dist=35000)
north=math.ceil(north*100)/100
south=math.floor(south*100)/100
east=math.ceil(east*100)/100
west=math.floor(west*100)/100
print(north, south, east, west)
Then define 400 boxes and calculate the Lat/Lon points for each
steps=20

grid=[]
for i in range(steps+1):
    lat=south+(i*round(north-south,2)/steps)
    for j in range(steps+1):
        lon=west+(j*round(east-west,2)/steps)
        node=ox.nearest_nodes(Graw, lon, lat)
        grid.append(node)
Now, loop through each point, find the nearest node, and calculate the time to get to it
ovingPoints=[]

for node in grid:
    try: #This is to capture the cases where the selected node has no path back to the origin.. I'm not bothered about these
        shortest_path = nx.shortest_path(Graw, oving_center_node, node, weight='travel_time')
        length=int(sum(ox.utils_graph.get_route_edge_attributes(Graw, shortest_path, 'length')))/1000 #in KM
        time=int(sum(ox.utils_graph.get_route_edge_attributes(Graw, shortest_path, 'travel_time')))/60 #in mins
        speed = (length)/(time/60) #speed in kmph
        if speed > 52: #If the hypothetical speed is ever greater than 52kmph, reduce it to that number
            time = (length/52)*60
        newPoint=Point((Graw.nodes[node]['x'],Graw.nodes[node]['y']))
        ovingPoints.append((newPoint, time, length))
    except:
        pass
Finally build some polygons which encompass reasonable travel times, less than 20 mins, 20-30 and 30+
ovingPointsLow = [point for point, time, length in ovingPoints if time < 20]
ovingPolyLow = gpd.GeoSeries(ovingPointsLow).unary_union.convex_hull

ovingPointsMid = [point for point, time, length in ovingPoints if (time >= 20 and time <30)]
ovingPolyMid = gpd.GeoSeries(ovingPointsMid).unary_union.convex_hull

ovingPointsHi = [point for point, time, length in ovingPoints if time >=30]
ovingPolyHi = gpd.GeoSeries(ovingPointsHi).unary_union.convex_hull
ovingPolyHi=ovingPolyHi-ovingPolyMid
ovingPolyMid=ovingPolyMid-ovingPolyLow
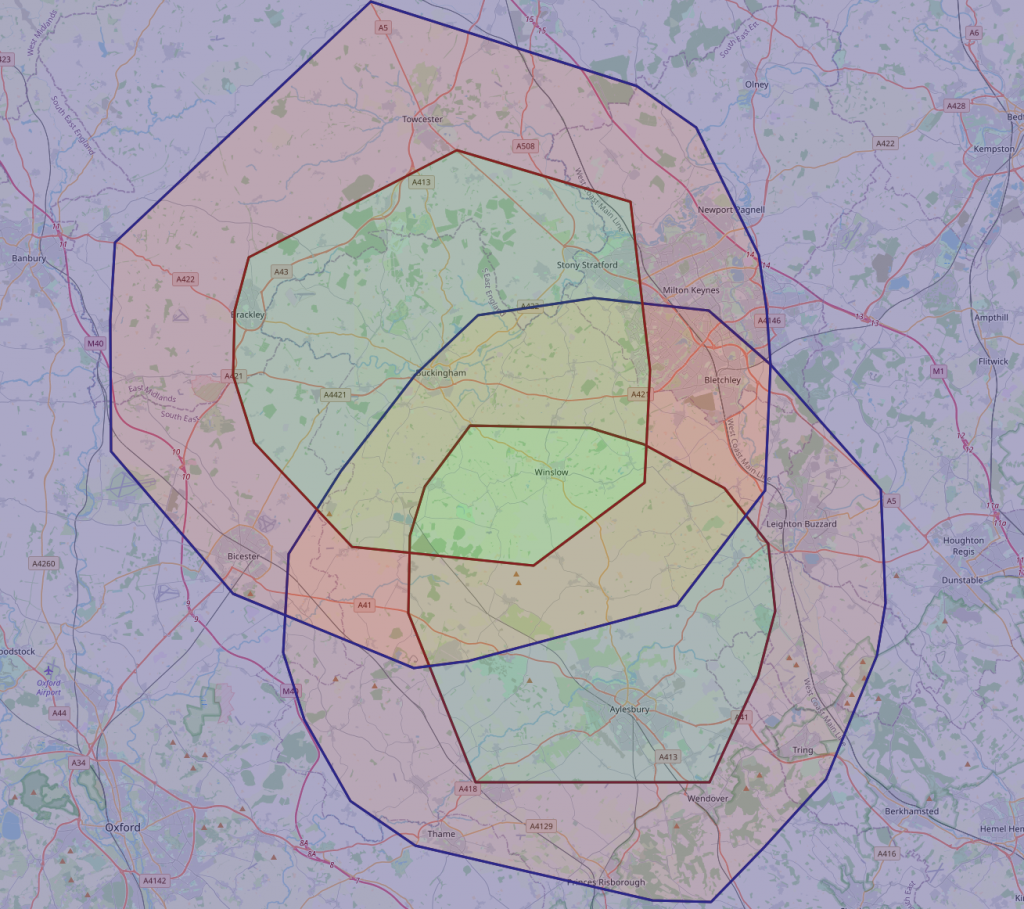
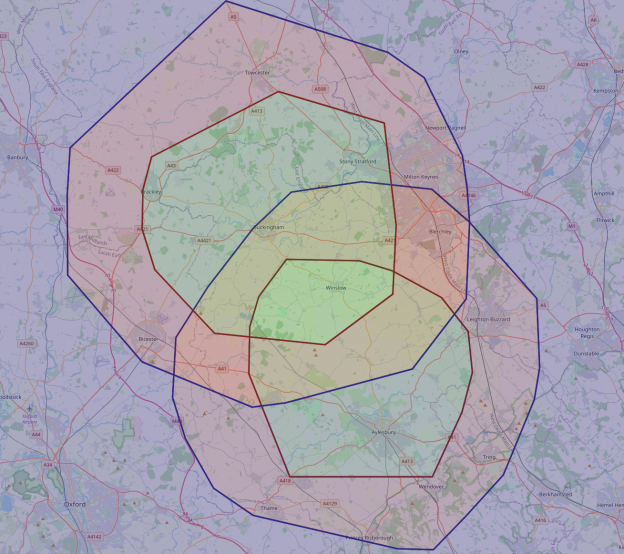
And plot the result on a map:

I’m happier with both the extent of the regions (I think that’s a reasonable distance to travel in the time – ignoring rush-hour around Aylesbury)
The regions are also much more circular, and critically, overlap.
Now, a bit more polygon maths and we can calculate the definitive areas of interest
buckinghamPolyLowMid = buckinghamPolyMid.union(buckinghamPolyLow)
ovingPolyLowMid = ovingPolyMid.union(ovingPolyLow)
jointPolyLow = buckinghamPolyLow.intersection(ovingPolyLow)
jointPolyLowMid=buckinghamPolyLowMid.intersection(ovingPolyLowMid)
#Create a new Foilum map to show my data
mapOutput = folium.Map(location=oving,tiles="openstreetmap",   zoom_start=13)

#Add my polygons
folium.GeoJson(jointPolyLow, name='Low', style_function=lambda x:style1).add_to(mapOutput)
folium.GeoJson(jointPolyLowMid, name='Low', style_function=lambda x:style2).add_to(mapOutput)

#Show the output
mapOutput

Ta-da!
I’ll let them know.
