Dunning-Kruger-Chatwin

There’s a thing I see all the time, working in and around Data & Analytics, which I think is making our lives more difficult than it needs to be. I’ve started (humbly) referring to it as Dunning-Kruger-Chatwin: an extension of the idea that people tend to over estimate their abilities in areas they know little about:

When faced with a problem, there’s a tendency of people within a specialisation to overthink the importance of their own expertise..

..and underappreciate the need for related disciplines to be involved

Me – 2023(ish)

What does that mean?

Specialisation of D/A roles
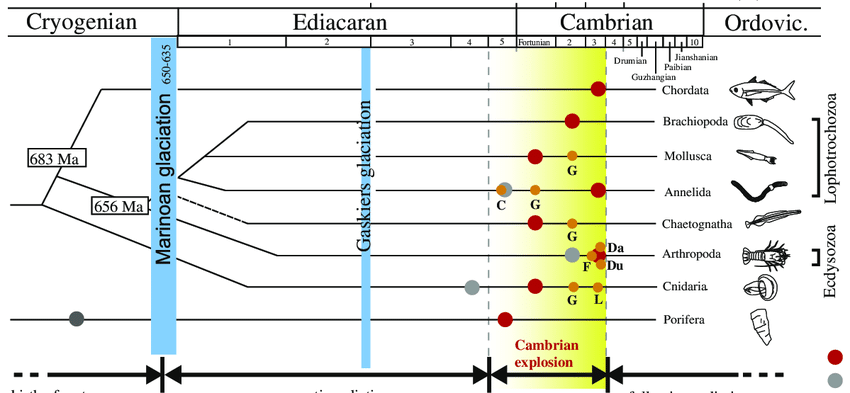
try to imagine this, but for different kinds of Data Geek (source)

A very long time ago everyone who worked with data was either a DBA or an Analyst*. Sometime in the early 2000s a kind of Cambrian Explosion started, fuelled by an increasing focus on the value of Data, big leaps in computational power, and the availability of new and more powerful tools.

These factors have lead to lots of new specialised roles, some of which (e.g. Data Engineer, Data Scientist) are viewable as direct descendants, others (e.g. Experimentation, Behavioural Economics) have grown as funky cross-overs* with other fields, or ways to solve problems.

Like the specialisation in early industry, this is generally a great thing. It’s supported big leaps in the benefits which can be created, and created a positive reinforcement cycle which includes things like the Chief Data Office concept, and myriad degrees and qualifications.

Specialise or die..?

Let’s consider two of the ways a Data Scientist is born – I’d argue there are similar stories for all the D/A specialisations

There’s a huge amount of social and corporate pressure for generalists to specialise. Data Science is rife with this. A ‘standard’ Analyst is bombarded with stories of the cool things DSs work on, the allure of Python, and the promise of more pay and seniority.

I’ve had dozens of conversations with analysts who wanted in to the DS world like they were trying to get tickets to see a band they’d only heard others talking about. To torture the metaphor: they can get into the gig before they really know if they like the music..

At the same time Universities have responded to the market pressure and created degrees, masters and doctoral qualifications which turn out highly technically qualified experts, but at the cost of a lack of practical business experience, which the Analyst->DS progression route avoids.

I’ve plenty of conversations with incredibly smart people who just want to make models, use new and more complex techniques. write articles and paper – and don’t care about the realities of delivering stuff in a business (deadlines, benefits, politics etc)*.

Neither of these routes is better than the other. I point them out to show that whichever type of DS you have in front of you, the inherent pressure on them is to get better at being a DS.

Solving problems as a specialist

Then a call comes in from the business – ‘We need a <data thing> to solve a <business problem>‘.

That request often has nowhere to go but a senior person in a team of specialists*. Hopefully some logic goes into who gets asked, based on the problem.. but not always. That senior person will use the scoping/planning/etc processes at their disposal, and soon a new project will be created.

And that project will be at risk. Why? Because most solutions don’t sit cleanly in a silo.

Even if the majority, even the overwhelming majority of a problem is actually a Data Science problem, there is always a need to bring in some data, or connect the outcome to a system, or visualise the result.

Specialists struggle with that, because it goes outside of their expertise, and it’s not the thing they’re incentivised to get better at. It’s down to the individual whether they reject/ignore the task, or try to helpfully reroute it, but often by that point it’s too late.

Dunning-Kruger-Chatwin

Here’s a comically simplified soultion map drawn from the point of view of a rigidly specialist Data Scientist*:

And the same thing from a rigidly specialist Data Engineer*:

Each puts a box (or two) in for the other, but look at the gaps:

You end up with a model based on rubbish data, which ends up taking years of rework to get into production.

OR (maybe)

You have a set of beautiful pipelines which after months of delay, it turns out the solution wasn’t modelleable anyway.

Look at the details too – The DS could be deep into auto-retraining before they think about where the data will be going.. and the DE could be worrying about the orechestration framework before wondering if the problem could be solved with a look-up*.

This is a trivial example. I borrow the bones of it from actual problems I’ve walked into the middle of, and tried to help clear up.

This is Dunning-Kruger-Chatwin. It’s real, it happens all the time in big and small ways, but the ultimate effect is we all look worse in the eyes of our stakeholders.

Why does this happen?

Something got lost on the journey of specialisation. I think it may now be being addressed by the concept of Data Products, but it’s not solved yet.

Let’s revisit the specialisation explosion from the point of view of a D/A team:

As the maturity of the team increases, there’s a push to specialise some of the roles, and that leads to big benefits. But as the whole team becomes siloed into specialisms, something is missing.

‘The Glue’ was originally the fact a single person could be responsible for the end to end. But the end to end in question was probably pulling some data from a stored SQL query into Excel with a nice VBA button.

But the world is more complicated now. That process could easily involve bespoke pipelines of data, complex summary statistics, and a whizzy UI. It’s not practical for specialist in any team to be able to do the whole thing, and, critically, there’s noone left who isn’t a specialist to take it on*.

How do we avoid this?

I think there are novel solutions out there, be it explicitly organising delivery around a Data Product, or just promoting workflows and processes which assume (rather than ignore) inter-connectivity.

I’d push for two (partial) solutions:

Make space for generalists – We shouldn’t be trying to undo the amazing leaps that have been made in the field. We (the D/A professionals) are richer because of it.

We should be making sure that generalism is respected and nourished as part of the curriculum that all D/A professionals follow. You don’t have to be an expert in every last part of the chain, you just have to be aware.

Be interested and open across silos – Most of these problems are solved by having enough respect for the whole problem to know when you are and aren’t qualified, and talking to other people.. but.. if you do realise you need more technical know-how to get a solution scoped, you need to know where to go to start the conversation, and that you won’t be shunned when you get there.

There’s an ugly side to specialisation which encourages fiefdoms and disrespect. It can stem from controlling leaders, inflexible procedures, or simply a lack of time.

By the way: It’s not just within D/A

I’m particularly interested in solving this problem in my own back yard, but DKC only gets bigger as you zoom out and involve more specialisms from across organisations – Risk and Data is often a spicy one* – again, these things usually start as a lack of understanding, which morphs into frustration, and eventually becomes a blocker.

Notes:

Wherever you see (*) please assume I’m simplifying deliberately, and absurdly, but knowingly 😀

Namesphere.co.uk – or – how I tried to use GenAI to retire early, and failed

A long time ago, I was sat in a corner of an office, and was involved in a conversation with a guy who made a small passive income from a website which contained some relatively trivial information, but for reasons I won’t describe, was highly searchable.

When LLMs came along, I started to think about how I could try and do something similar. I’m not sure when the idea for a website about people’s names came to me, but it seemed to fit the brief:

  • Highly searched (‘what does my baby’s name mean?’, ‘what are names like X?’)
  • Low impact of wrongness (who’s to say what Alex really means?)
  • Potential to generate both specific content about names, then click-baity articles about those names

All toegther, this seemed like a possible winner: Get the site up and running, pop some content in there, adsense, ???, profit!

Here’s the result, if you want to skip to the good bit: https://namesphere.co.uk

The architecture

I’d used HTML and PHP a lot as a ‘kid’, and even scored a job building a website for a schoolfriend’s family business. More recently I’d got something working in Angular, so that seemed a sensible start

I wanted to avoid any cost for this project, other than maybe a domain and some setup, so I came across Firebase, and it seemed to have decent documentation for Angular deployments. The content of the site would sit in Firestore, and be called dynamically into my Angular app.

This ended up biting me pretty severly, as although everything worked ok, the dynamic site rendering was only crawlable by Google.. more on that later.

The content

I’d played with some offline LLMs when they first hit the headlines, and the wrappers have only improved since.

koboldcpp – let me run any models I liked, with CUDA optimisations, in windows. Crucially it also came with a local API interface. I just wanted quick-start, so this was perfect

TheBloke – I can’t remember how I found this person’s work, probably a reddit post/tutorial, but I really liked the way they summarised the model quantisations they’d made. In the end, I used a mix of capybarahermes 2.5 mistral models for the gen.

I wanted to do two things:

Defintions – a page for each of the names, with a set amount of content, e.g. a defintion, some alternative names, then some other fillere

Articles – some text which pupported to be magazine content written by different authors for a website about names – this would be the dynamic content which might help funnel traffic.

Definitions

I got a list of names from the ONS, and then did an unnecessary amount of processing on it. First I wanted to remove male/female duplication, then I wanted to sort by a sensible measure of popularity – initially I might only work on the most popular names.

One of the biggest issues was getting the LLM response to neatly fit a website template. I iterated over a lot of different prompts, eventually settling on:

    <|im_start|>system
    You are a helpful staff writer and researcher for a website which specialises in peoples names, their origins and meanings. you reply truthfully. you always reply with html formatting<|im_end|>
    <|im_start|>user
    I'd like to know more about the name {name}. please complete the following sections, please wrap each section heading in an <h2> tag, and the remaining text in a <p> tag. The list should be in <ul> with <li> elements. do not use <strong> tags. you may use </ br> line breaks if needed.
    origin
    meaning
    current usage
    aspirational summary
    5 common nicknames
    <|im_end|>
    <|im_start|>assistant

Initially I’d gone for a more robust approach of each section separately, but with around 30k names, this was just taking too long. It was quicker to have each name return all the data.. but.. at the cost of less reliability in the output

In the end I applied a section ‘reviewer’ stage which checked for the basics, like number of html tags. Any names which failed were requeued for generation, and it usually worked second time around.

The Data

The records were stored as the HTML which would be injected into my angular template. This massively increased the potential for any janky formatting from the LLM to get into the site, but typically the output was very good.

And after a few days of batch running/cleansing, I had a lot of defintions

I haven’t checked even a fraction of the total, but every one i’ve seen looks like a reasonable output. Certainly enough to get some clicks!

Articles

This was a bit more fun, and I went overboard.

First I used ChatGPT to create a set of author personas – one of my key findings here is how much more reliable and fast ChatGPT is than anything I worked with offline.

Then I had a separate ‘Editor’ who prompted each writer with some ideas of what was wanted. This was utterly overkill, and I spent a lot of time just making this ‘office politics’ work properly.

The articles were then served up via a flask front end, so I could make tweaks, and eventually upload them to the site.

I saved a lot of the data from the early steps so I could re-run and tweak as needed

Namesphere

No idea why I called it that.

Now I’ll be the first to admit that I shouldn’t be allowed anywhere near a website editor, but, here it is:

My articles were attributed, and contained links to the appropriate detail:

And then the name defintions sat seperately:

The result

It actually worked.

I’d burned probably 24-36 hours of PC time, with my trusty nvidia 3070 doing a lot of the work, but I had a massive amount of content.

The output

One of the things which suprised me the most was how I never found a dodgy bit of information in the output. Somehow, coded in each of my 4-8gb models was a staggaring amount of detail about the naming practices of different cultures. Especially if you aren’t worried about being sued for getting it wrong

The formatting remained an issue. Particularly for the articles, some of my writers would go off the deep end, and produce something which couldn’t be easily returned to the formatting I wanted.. but.. I could re-run the whole thing in a few minutes, and it usually came good in the end.

My millions

I’m writing this from the Maldives, where my passive income has…

No.

Sadly not.

With everything up and running, I’ll admit I got very excited. I started getting into SEO articles, worrying about the way Angular’s client rendering handled meta tags, and was even arrogant enough to apply to adsense.

And with, kind of, good reason:

That’s my first 10 days since launch. I felt giddy.

Then it all went wrong. This is the full picture, to roughly today.

I’ll never know for sure if I got lucky at the start, or unlucky at the end (reddit tells endless stories about google’s algorithm changes). Honestly it’s probably for the best that my clearly AI generated content isn’t making it to the first page of the worlds biggest search engine.

My decision to use Angular and dynamic data also torpedoed my ability to list with other engines.

What did I learn?

  1. LLMs/GenAI are really cool, and for a certain set of circumstances, you can get amazing things from them
  2. Angular is a PITA. No tool should be releasing major version increments that often. It risks looking like Python’s package black-hole.
  3. There’s no such thing as a free lunch – Maybe my next idea will be a winner, but for now, I’m at least pleased my bill has been essentially £0

Perhaps when I have a few minutes I’ll create a static version of the site, and have a go at automating some social media engagement drivers. Watch this space!

Data Translator – another consultancy fad?

6-month-old’s morning feed was punctuated by an interesting question, which has led to some interesting answers, so here’s a longer-form thought on the ‘Data Translator’ role:

Mark’s question, in it’s entirety, links to a McK article which describes this new role:

I take a fairly hard-line view on this, ‘translation’ is a fundamental skill any decent analyst must have.

The Glue

In most analytics situations you have a gap between the data-person and the business-person and you need some glue to bridge that gap.

Ideally that gap is very small – the business expert can explain their problem in their own terms, and answer any questions answers. The analyst should be leading that conversation, asking the questions, mapping out the problem in DA terms, and proposing back a solution to the business problem.

Sometimes the gap is bigger, and more glue is needed, but in my experience, that responsibility falls best where it’s best handled, and that’s with the analyst.

Projects and delivery fail where the gap isn’t closed.

Making a new role to do this business interlock is just creating two gaps where there was once one. It’s not a shock that a consultancy would propose it – it’s how consultants work. It doesn’t always work well, especially client-side.

Farming Data Scientists

The need to fill a numbers gap in roles like Data Scientist have led to the creation of degrees and doctorates to turn out graduate Data Scientists. This isn’t new, but the scale has grown a lot.

People doing the most advanced analysis roles in business 10-15 years ago were often just the most experienced analysts. They had time under their belts, and curiousity had lead them to develop both data and commercial acumen. They were also often the best at working their way around systems and data to produce solutions.

1 second bugbear – this person was originally the definition of a Data Scientist.. but I’m learning to let that go 🙂

The new crop, with their considerable training in very complicated maths, are formidable, but it’s clearly crazy to think they’d have the same commercial experience as their “free range” colleagues.

Data Science as an academic persuit attracts people who love numbers as much as solving problems, and so it’s quite possible none of these folks actually want to spend their time learning the nuances of business processes/problems, or dealing with the people who do.

Our most technically skilled data manipulators are now often our least experienced colleagues.

The hyperspecialisation of DA roles

With more centralisation of DA teams (via the ‘Chief Data Office’ concept), and the increasing use of flavours of Agile, there has also been an increase in the specialisation of roles.

When everyone was an ‘analyst’, you still had people who were better at the data manipulation, the analysis or the presentation, but it was less acceptable to do one to the exclusion of the rest.

Now it’s common to have multiple DA specialisms on a delivery team, and strong opinions on who should do what. And who shouldn’t have to do what.

The availability of a Data Translator role allows everyone else to say it’s not their job.. perhaps with the implication that it’s either less skilled or important. It also gives another person to blame, should things not work out as planned.

There risks being no incentive to broaden, instead always prizing deeper and more theoretical work.

Isn’t this just what a consultancy would sell as a service?

Kinda. That idea of going out to find high impact work, prioritising and building a programme to deliver it feels very McK.

That doesn’t mean it’s wrong in principle, but experience tells me that unless these ‘translators’ are already deeply embedded in your team, they’re going to be off selling sky hooks and snake oil.

So Data Translator is rubbish then?

no.

Established teams with working patterns

I’m convinced that somewhere in the world, probably more than once, this has worked.

if you can solve the problem’s inherent in the model, this could be very productive.. I just haven’t seen it working.

I could imagine a large, established, research-focussed data science team, with seasoned delivery pathways, and a mature set of processes for making decisions/logging work/putting live/evaluation outcomes.

I can imagine it, but I’ve not seen it.

The gap DOES exist

The two problems (Farming of DSs, and hyper-specialisation) I’ve described exist today, and are causing teams problems.

I’m willing to believe that a Data Translator could solve a problem. I just wish it could be solved a different way. I think it’s a short term sticking plaster which will fail as it’s not actually tackling the root cause.

Roles, not Souls

Our Data Translators should already be in our teams. They’re wearing other hats right now, but they can grow into this role too.

We need to unpick the problems which made the role feel necessary – encouraging our specialists the option to grow wider and well as deeper and still have the same potential for progression.

Without this, we’re going to keep having disconnections between the business and the data, and we’re starving a pipeline to senior DA leadership for the future.

‘Cheating’ at Tuble

Since Wordle took the world by storm, a large number of innovative clones have emerged, one which I was pointed to recently is Tuble, where the aim is to guess the correct Tube Station in as few attempts as possible.

Once the initial fun dies down, I’ve quite enjoyed looking at these games as analytical puzzles, and finding an algorithm to solve them.

The Problem

This belongs to Tuble.co.uk

As you make guesses, the game returns two data points to help you refine the next guess. The colour of the blob tells you how many zones are between the guess and the answer, and the number is how many station stops it would take to get there.

Tube map | Transport for London
This belongs to TFL

The Tube map is pretty well known, especially for Londoners, and the game only includes the core tube (no DLR, no TFL Rail, and also no Crossrail). Turning the map into data is a graph problem, and the biggest hurdle is turning the picture above into a collection of node and edge data.

The solution

  1. Get the station data into Python
  2. Determine the possible answers given guess(es) made
  3. Determine the next best guess

1. Getting the data into Python

A quick google pointed me to this blog post (thanks Mark Dunne!), Mark had already found this github repo (thanks Nicola!) which had pre-built csvs with the info needed to build a networkx graph representation of the tube.

connections = pd.read_csv('london.connections.csv')

#filter out DLR
connections=connections[connections['line']!=13] 
connections=connections[connections['line']!=5]

station1=connections["station1"]
station2=connections["station2"]
stationMasterList=list(set(pd.concat([station1, station2]).to_list()))

stations=stations[stations.index.isin(stationMasterList)]

This first step removes the DLR and ELL stations (which aren’t in the game)

Then I’ve shamelessly copy-pasted this code from Mark’s notebook

graph = nx.Graph()

for connection_id, connection in connections.iterrows():
    station1_name = stations.loc[connection['station1']]['name']
    station2_name = stations.loc[connection['station2']]['name']
    graph.add_edge(station1_name, station2_name, time = connection['time'])
    
#add the connection between Bank and Monument manually
graph.add_edge('Bank', 'Monument', time = 1)

I’ve now got a graph with all my stations (nodes) and lines (edges).

2. Determine the possible answers given a guess

I’m not sure if there’s a more efficient way to do this, but the first iteration is just a loop through all the stations in the graph, and adding them to a list if they meet the conditions of the last guess.

def getPossiblesList(startStation, maxDistance, zoneFlag): #zoneFlag takes values as: green=0, yellow=1, orange=2, red=3
    startZone=stations[stations["name"]==startStation]["zone"].item()
    returnList=[]
    for id, stat in stations['name'].iteritems():
        if len(nx.shortest_path(graph, startStation, stat))-1 == maxDistance:
            details = stations[stations["name"]==stat][["name", "zone", ]].to_records(index=False)
            name=details[0][0]
            zone=details[0][1]
            if zoneFlag==0:
                if startZone==zone:
                    returnList.append(name)
            if zoneFlag==1:
                if abs(zone-startZone)>=1 and abs(zone-startZone)<2:
                    returnList.append(name)
            if zoneFlag==2:
                if abs(zone-startZone)>=2 and abs(zone-startZone)<3:
                    returnList.append(name)
            if zoneFlag==3:
                if abs(zone-startZone)>=3:
                    returnList.append(name)
    return returnList

My first guess is 16 stops from the correct station, and 1 zone away (plus or minus), given that, here are the possible stations which meet the criteria

['Holloway Road', 'Bethnal Green', 'Finsbury Park', 'Chalk Farm', 'Kentish Town', 'Bermondsey']

This is probably something you could do in your head, and leaves a much reduced number of possible options

3. Determine the next best guess

It will almost always be best to guess one of the stations in the shortlist, but there may be a better guess which limits the possible options more

E.g. if the possible stations are Regent’s Park or Piccadilly Circus, a guess of Oxford Circus wouldn’t help atall. Green Park would be better as you’d know exactly which station was right based on the feedback

However, given there are only 2 options, it would be much more sensible to guess one of those options as you’ve got a 50% chance of ‘getting lucky’.

Gut feel is that there could be an edge case where guessing from the shortlist would risk you getting less information than a non-shortlist station, in which case you’d be gambling a possible win on the next turn, vs a definite win on a subsequent turn.

def tubleResult(startStation, endStation):
    path=len(nx.shortest_path(graph, startStation, endStation))-1 #minus one as both stations are included in the result
    startZone=stations[stations["name"]==startStation]["zone"].item()
    endZone=stations[stations["name"]==endStation]["zone"].item()

    if abs(endZone-startZone)<1.0:
        zoneFlag=0
    elif abs(endZone-startZone)>=1 and abs(endZone-startZone)<2:
        zoneFlag=1
    elif abs(endZone-startZone)>=2 and abs(endZone-startZone)<3:
        zoneFlag=2
    elif abs(endZone-startZone)>=3:
        zoneFlag=3
    return(path, zoneFlag) #zoneFlag takes values as: green=0, yellow=1, orange=2, red=3

This code returns the values which the game would give you if you guessed a ‘start station’ and the correct result was ‘end station’. Using this, I can compare the information I’d get from using different guesses and select the one with the least ambiguous outcome.

fullList=[] #a full list of the stations, for the case where there are no previous guesses
for id, stat in stations['name'].iteritems():
    fullList.append(stat)

guesslist=[]
guesslist.append(('Ealing Broadway', 16, 1)) #Station name, number of stops away, encoded colour of the tile

returnLists=[] #store all the possible answers, based on guesses
for guess in guesslist:
    returnLists.append(getPossiblesList(guess[0], guess[1], guess[2]))

remainderList=[] #this will store a unique/deduped list of stations
if len(returnLists)==0:
    remainderList=list(set(fullList)) #clumsy dedup
else:
    remainderList=list(set.intersection(*[set(list) for list in returnLists])) #funky bit of code which I hope gives me the intersection of all results
    print(remainderList)

In the absence of a proper UI, the user adds more lines to the ‘guessList’, and the code runs from that.

if len(remainderList)==1:
    print ("The answer is "+remainderList[0])
if len(remainderList)==2:
    print ("The answer is either "+remainderList[0] +" or "+remainderList[1])
else:
    #Remainder List Loop
    bestDiff=1000
    bestStation=""
    for guessStat in remainderList:
        outcomes=[]
        for remainderStat in remainderList:
            outcomes.append(tubleResult(guessStat, remainderStat))
        numOutcomes=len(outcomes)

        numUniqueOutcomes=len(set(outcomes))
        diff=numOutcomes-numUniqueOutcomes
        if diff<bestDiff:
            bestDiff=diff
            bestStation=guessStat

    #Full List Loop
    for guessStat in fullList:
        outcomes=[]
        for remainderStat in remainderList:
            outcomes.append(tubleResult(guessStat, remainderStat))
        numOutcomes=len(outcomes)

        numUniqueOutcomes=len(set(outcomes))
        diff=numOutcomes-numUniqueOutcomes
        if diff<bestDiff:
            bestDiff=diff
            bestStation=guessStat

    print('The best guess is ' +bestStation +" with a duplication of "+ str( bestDiff))

This block of code will return one of 3 outcomes, a single result, a pair, or the best guess. I loop the final step first through the remainder list, then through all stations. If no station gives more information than one on the remainder list, I’d rather pick from that list – just in case I get lucky!

The performance

It works!


How many rooms does a labour ward need?

Labour ward at Wexham Park Hospital

We recently welcomed our second son into the world, and while my wife waited for a labour room to become free, we discussed the complexity of deciding how many rooms any given hospital must need. I wondered about the information available, and how they can prepare for spikes.. and that got me thinking about how to model it.. so here goes

I’ll be including good and bad outcomes of the pregnancy journey – please consider if you’re comfortable reading that before you continue.

The problem

A human pregnancy lasts around 40 weeks. Most babies arrive between 38 and 42, but there are lots of reasons why a baby can arrive earlier than that. In the UK, mothers to be are offered a range of options for where they would like to have their baby, roughly: Home Birth, Midwife-lead units, Labour wards.

Some of the home births end up moving to a medical setting due to complications, but most women who give birth in hospital will head there when they’re in established labour. A small proportion (including my wife) will be induced for various reasons, and they’re admitted before labour starts.

There are a limited number of rooms available in any labour ward (more so since Covid, as hospitals have typically set up quarantine rooms form mums-to-be who have the virus). It’s not immediately clear how much pressure these rooms are under as the overlapping situations for each mother vary.

I want to start with an agent-based approach:

  1. Creating new Women at a rate which is consistent with UK stats
  2. Simulating the success rates for each as they progress
  3. Simulating a start of labour (again, consistent with the distributions in the real world)
  4. Simulating a total time needed in a room to give birth, and rest afterwards

I can then analyse these stats to see how many rooms would be needed.

Step 1. Women

Statistic: Conception rate in England and Wales in 2019, by age group (rate per 1,000 women)* | Statista
Find more statistics at Statista

There are lots of useful stats available for this project, starting with the above, which I can piece together. As a starting point, I’m going to choose a population size, then assign them ages which match the UK distribution.

I’ll then run the population over a period of time, by day, giving each a probability of falling pregnant, then for those who are, running the course of each pregnancy to get my outcome.

class Woman:
    ageYears: int
    ageDays: int
    pregnant:bool
    conceptionDt: datetime
    dueDt: datetime
    termWeeks: int
    termDays: int
    formerPregnancies: list
    labourList: list

    def __init__(self, _age):
        self.pregnant=False
        self.ageYears=_age
        self.ageDays=0
        self.formerPregnancies=[]
        self.labourList=[]

Part of the point of this is to get some stats at the end, so along with some obvious properties, I’ve got a couple of lists to store the results of previous pregnancies, and the details of each simulated labour.

2. Simulating success rates

Again, content warning here, I’m not being gruesome, but having kids isn’t always smooth sailing.

My simulation starts with an almost unknown commodity, the day of conception. Practically it’s almost impossible to know this, but it exists.

From the point of (simulated) pregnancy, there are a set of outcomes I’m allowing by probability.

  1. Miscarriage – loss of a pregnancy in the first 20 weeks
  2. Termination – decision to end the pregnancy within the first 26 weeks
  3. Birth – entering labour and delivering a baby

Much, much more depth could exist here, but I think this will be enough to give me the data I want.

3. Simulating start of labour

This is probably the most interesting bit for my problem, but I like the idea of the having more accuracy behind it. Modelling the ages, and age related outcomes gives me more nuance in the analysis at the end.

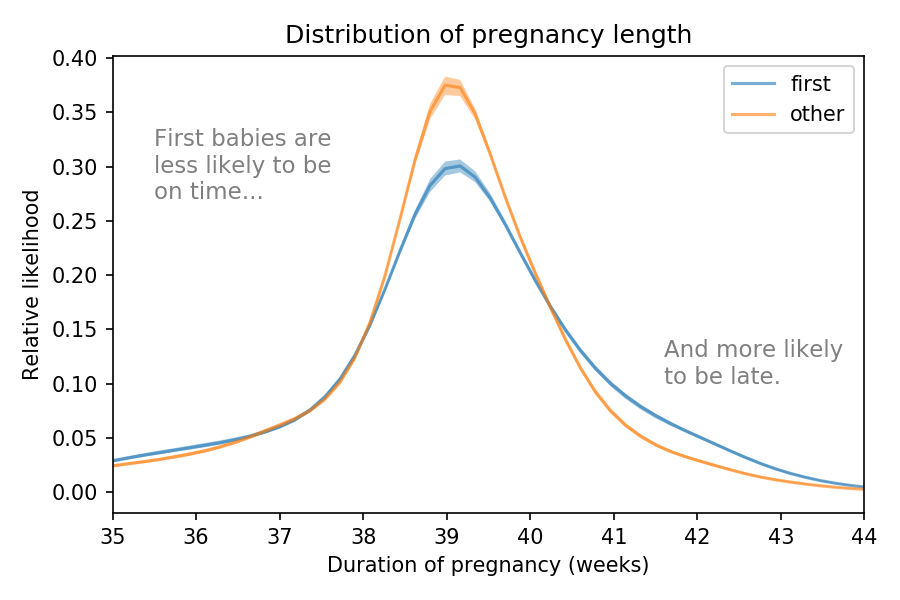
Are first babies more likely to be late? | by Allen Downey | Towards Data  Science
There are lots of charts like this on the web, the basic message being that due dates are meaningless

It’s this distribution which started me wondering about the way this would play out across a bigger population, and therefore how confident the NHS can be about the number of labour rooms.

4. Total time in labour

def labourStageCalcs(_ageYears, _termWeeks, _date):
    offset=randint(0,23) #pick a random hour of the day for things to kick-off
    DT=datetime.datetime.combine(_date, datetime.datetime.min.time())
    
    firstLatentStageStDT=DT+timedelta(hours=offset) #Start of contractions
    lenFirstLatent=gauss(12,4) #assume mean 12h, SD 4
    
    firstActiveStageStDT=firstLatentStageStDT+timedelta(hours=lenFirstLatent) #Start of active labour
    lenFirstActive=gauss(6,2)
    
    secondStageStDT=firstActiveStageStDT+timedelta(hours=lenFirstActive) #Start of 'pushing'
    lenSecond=gauss(1,0.5)
    
    thirdStageStDT=secondStageStDT+timedelta(hours=lenSecond) #Baby is born, the cleanup begins
    thirdStageEnDT=thirdStageStDT+timedelta(hours=6) #Give each women 6 hours in the room to recover

    return firstLatentStageStDT, firstActiveStageStDT, secondStageStDT, thirdStageStDT,thirdStageEnDT

At this stage, I just want something which works, no nuance by age/etc

The results

Assuming a female population of 200k, with no current pregnancies, run for 720 days, this show the ramp up of pregnancies

Around 9 months later, the population hit’s a steady state with around 2.3k women pregnant at any time.

This shows a daily view of the maximum number of beds occupied at any time

And here as a table. The average (mean and median) is 5, with only 5 days needing 10 or more, and only one needing 11 – the highest on any given day

This answers most of my original question. Given a known population, it’s not a big surprise that the number of pregnant women hits a fixed level – I’ve created that by adding a constant number (based on the UK population rate). It’s more interesting that the randomness surrounding the actual birth still results in a number of rooms which can be estimated ahead of time with reasonable confidence.

In future iterations, I’d like to look at the data which would be available to the hospital ahead of time, and maybe add some more variability based on things like age.